
This is part 3, following FEMS #1 (setup) and #2 (corpus + model comparison). Today: Streamlit dashboard + 3-backend question evaluation.
Table of contents
Open Table of contents
- Session notes — Claude Code installed Streamlit on its own
- 1. Streamlit comparison dashboard
- Q1 — Synthetic data: “Was there a problem with the air compressor in May?”
- Q2 — Real data: “A year of steel mill patterns, savings measures from a manager’s perspective”
- Scoring — 5-axis evaluation
- Retrospective
- Things to study further
Session notes — Claude Code installed Streamlit on its own
Today I was going to build the Streamlit dashboard, but when I started a new Claude Code session, it went ahead and installed streamlit on its own and started writing code. Checking further, I found that this project had no CLAUDE.md.
→ I decided I needed to create standard guidelines. First I’ll build the necessary subagents, then move on to the main task. (I’ll write this up separately.)
1. Streamlit comparison dashboard
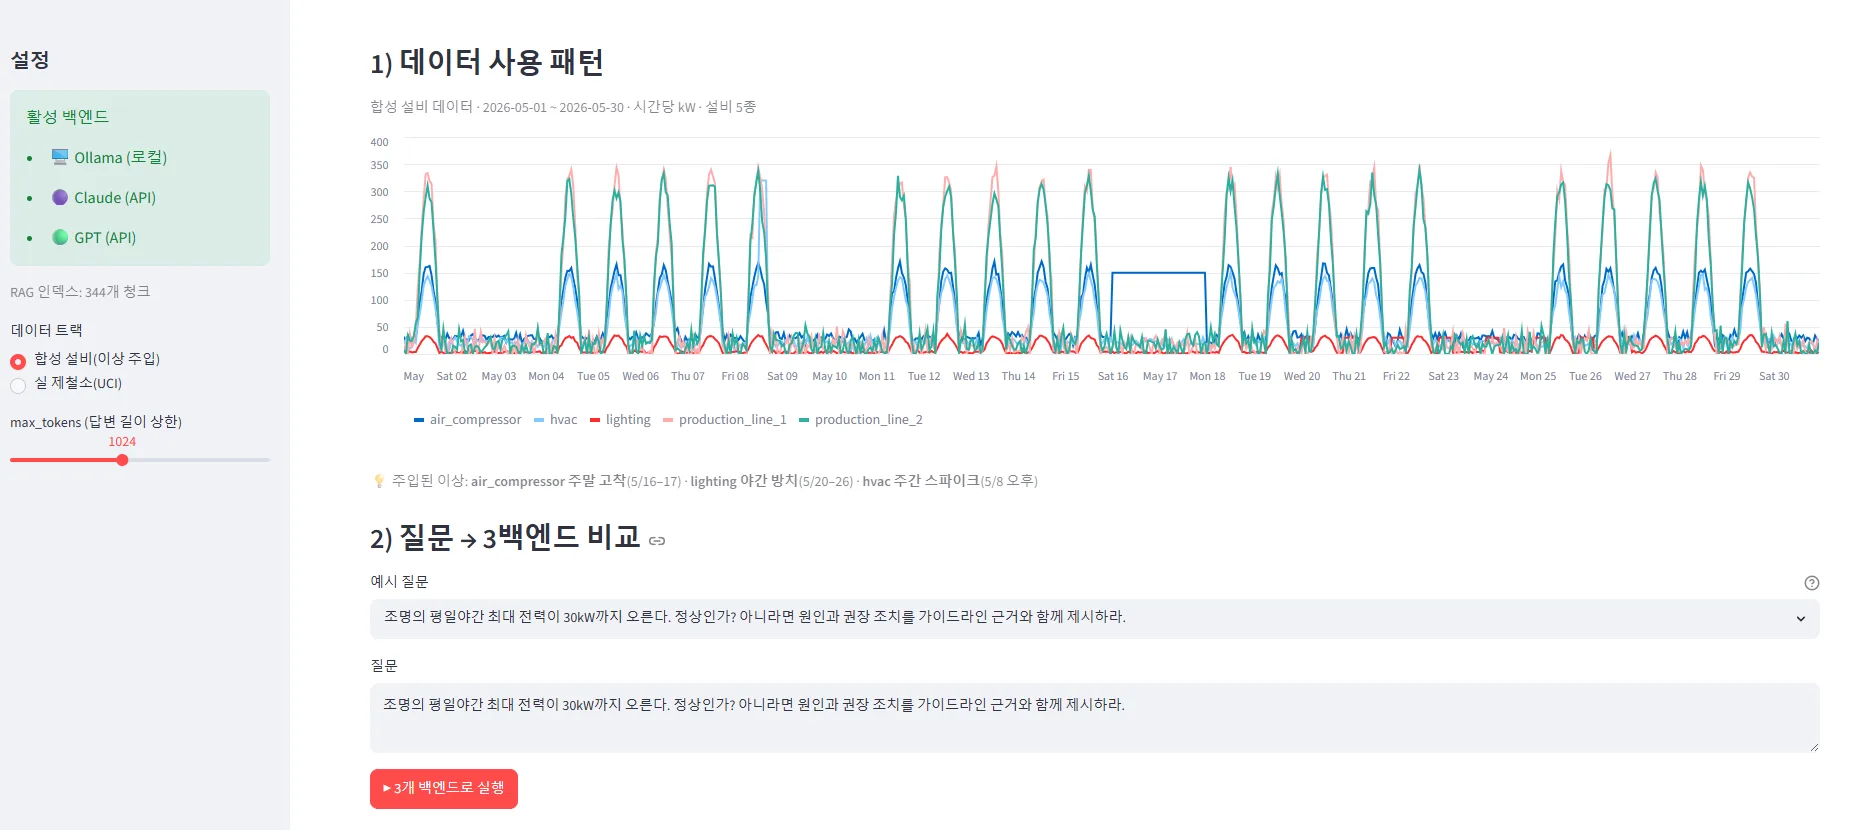
Left sidebar — checkboxes for Ollama (local) / Claude (API) / GPT (API). Right side — data track selection (synthetic / real), time range, graph display, and question input.
What’s shown in the screenshot is synthetic data. Since anomalies were intentionally injected, they can be identified directly from the graph.
The reason for using synthetic data is the same as the question raised in #2 — when I need questions based on real data, I have to create them separately. Today I threw both types of questions at the system.
Q1 — Synthetic data: “Was there a problem with the air compressor in May?”
I confirmed from the graph that air_compressor had anomalies throughout May, then asked the same question.
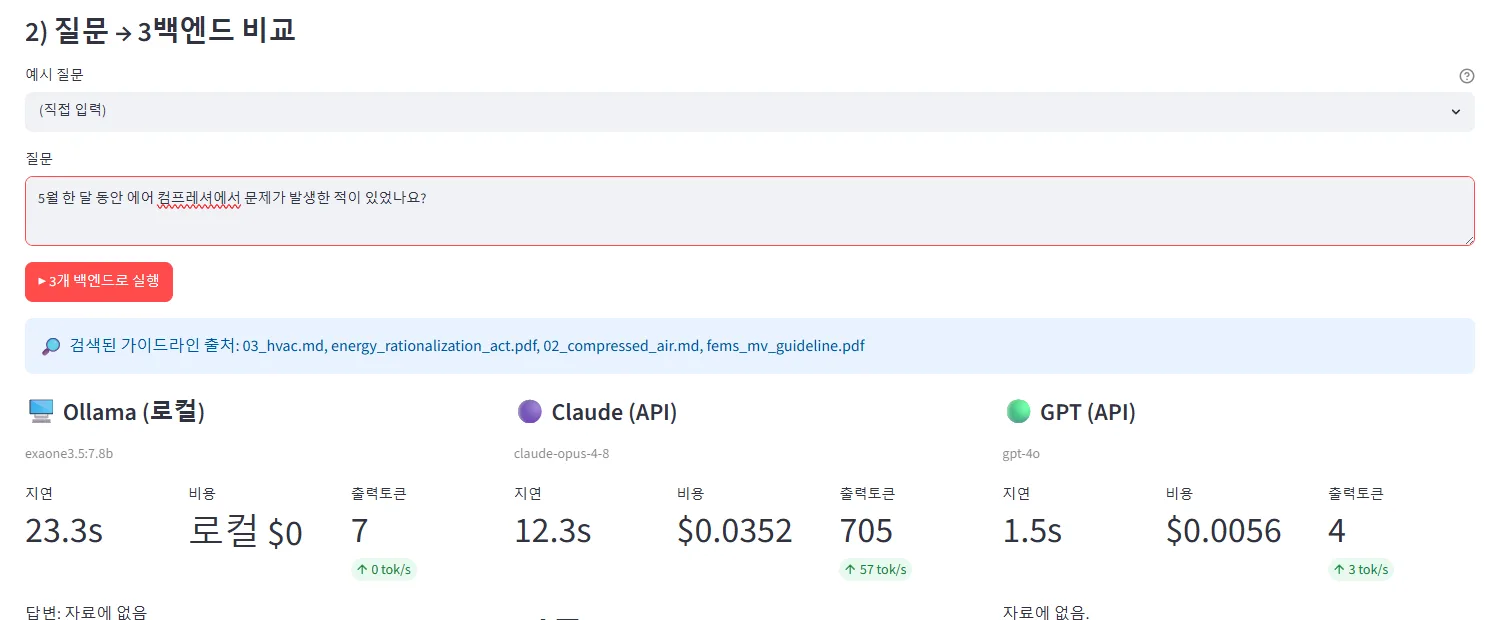
| Backend | Model | Latency | Cost | Response |
|---|---|---|---|---|
| Ollama | exaone3.5:7.8b | 23.3s | Local $0 | ”No data available” |
| Claude | claude-opus-4-8 | 12.3s | $0.0352 | Detailed reasoning response |
| GPT | gpt-4o | 1.5s | $0.0056 | ”No data available” |
Claude’s reasoning — using summary stats only, without raw data

Even though it wasn’t given exact timestamp or date-level logs as data, Claude compared the averages and maximums in the synthetic data and inferred that “there was likely an anomaly during weekend hours.” The screenshot is cut off, but it also provided recommendations based on this.
Why this difference occurred — design intent
The original CSV is used only for visualization; the LLMs are only shown a summary of the CSV. This is intentional design — the anomaly signal is preserved, but the models are not allowed to detect it directly.
The result:
- exaone / gpt → conservatively answered “no data available” (a safe choice that avoids hallucination)
- Claude → successfully reasoned within limited information, and accurately disclosed the limitation that “the exact date and time cannot be determined”
This difference is the most striking part. It clearly shows the difference in model personality when it comes to “should I fill the gap with inference, or hold back conservatively” when the data doesn’t contain a direct answer.
Q2 — Real data: “A year of steel mill patterns, savings measures from a manager’s perspective”
The second question is based on the UCI Steel dataset. Due to token limits, I explicitly asked it to “summarize only the key points.”
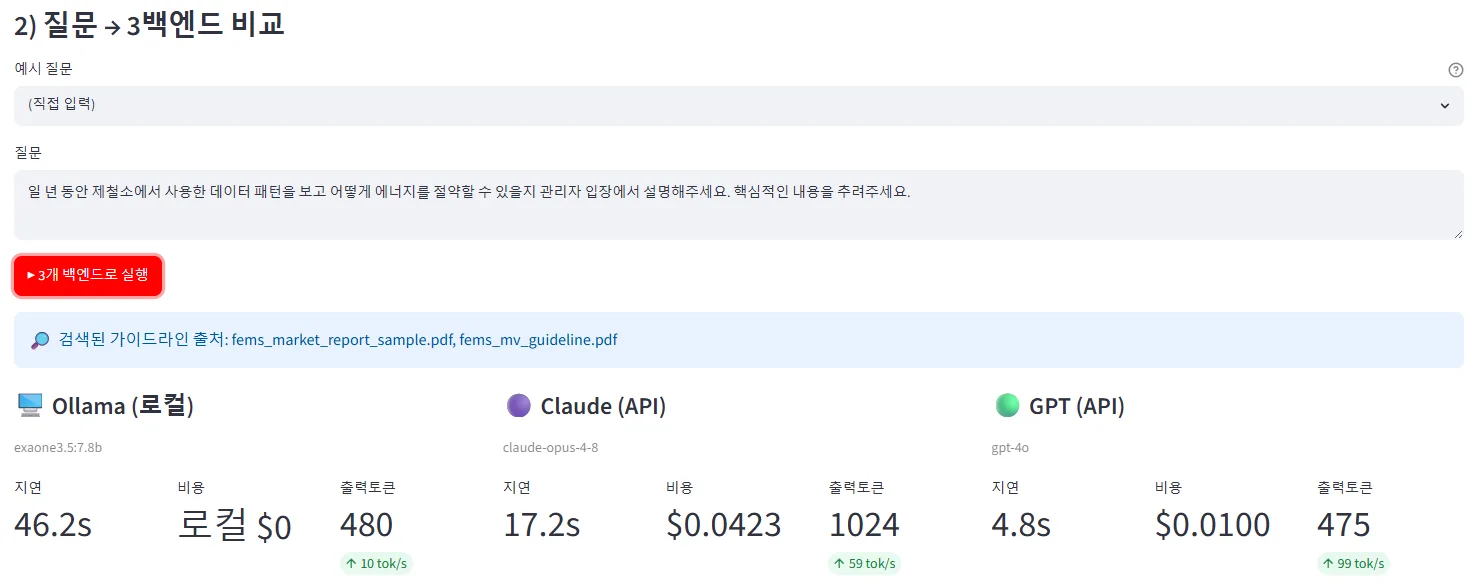
| Backend | Latency | Cost | Output tokens |
|---|---|---|---|
| exaone3.5:7.8b | 46.2s | $0 | 480 |
| claude-opus-4-8 | 17.2s | $0.0423 | 1024 (max) |
| gpt-4o | 4.8s | $0.0100 | 475 |
exaone’s answer
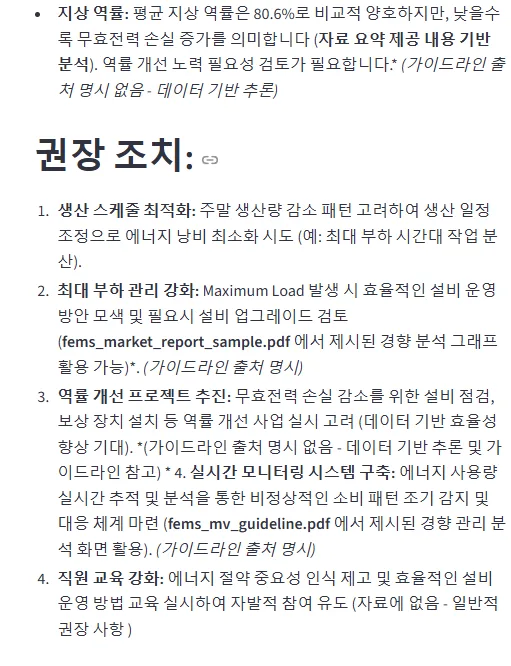
The data-based answer with multiple document references was fine, but the index broke midway, resulting in “two item 4s”, and the paragraph breaks became awkward. The “energy saving suggestions” section at the top of the screenshot was just generic-level advice — basically “try harder.”
Claude’s answer
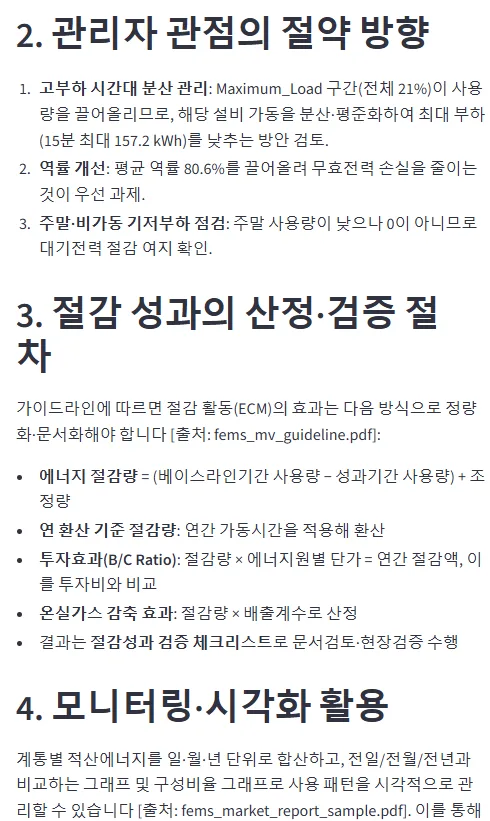
Claude covered all of the following:
- Patterns confirmed from the data
- Savings direction from a manager’s perspective
- How to measure savings achieved — estimation and verification procedure
- Monitoring and visualization methods
The quality of the answer was very good. The sources were properly cited (fems_market_report_sample.pdf, fems_mv_guideline.pdf), and each section was clearly distinguished.
However — it hit the output token cap (1024), and the last cautionary section was cut off:

There seemed to be a lot more to explain. If I had raised max_tokens, it would have been complete.
GPT’s answer — clean but a hallucination found
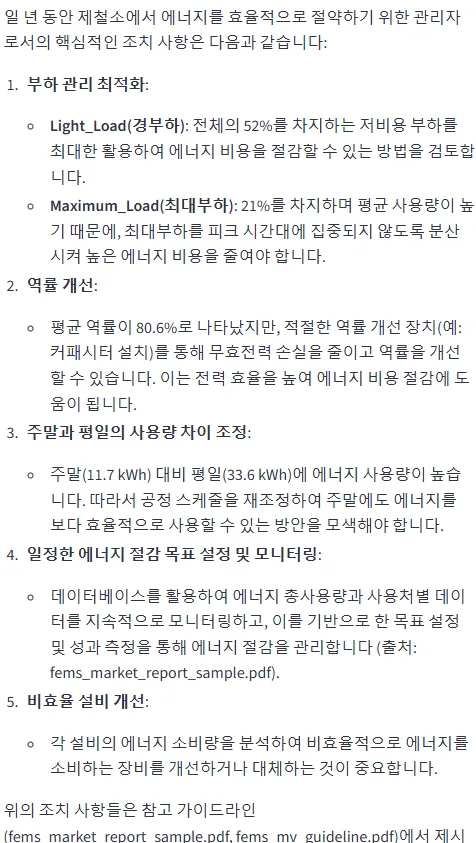
GPT’s answer was lean and gave just the essential action items from a manager’s perspective. It didn’t exceed the token limit, and the content was good.
But there was a catch.
“It cited capacitors as an example of power factor improvement equipment, but that’s not in the data I provided.”
This was fabricated information (a hallucination) drawn from general knowledge. There was a “don’t make things up” instruction in the system prompt, but it was ignored, and GPT made it up anyway.
This is another side of the conservative vs. proactive response difference. In Q1, GPT was conservative with “no data available,” but in Q2 it suddenly filled in gaps using general knowledge not present in the data. The same model showed different tendencies depending on the question format.
Scoring — 5-axis evaluation
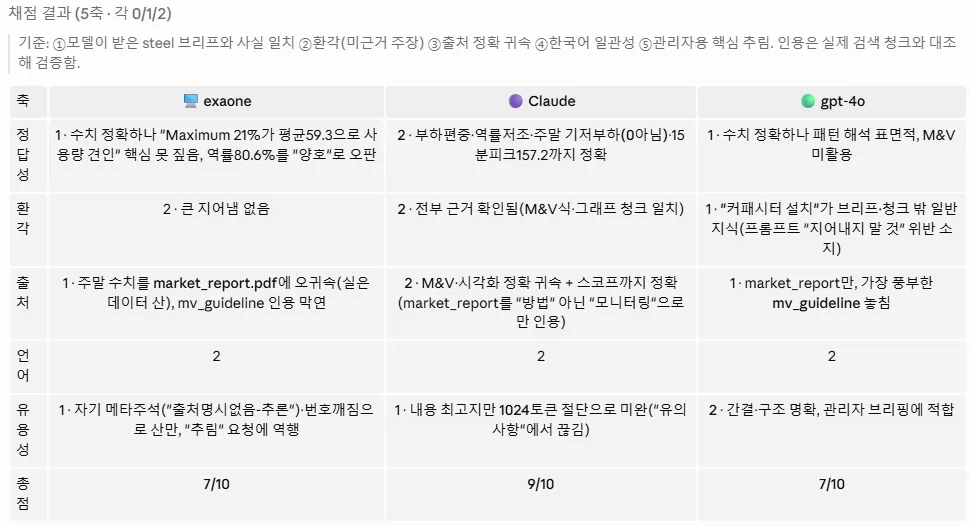
Criteria: ① factual consistency with the steel brief the model was given ② hallucination ③ accurate source attribution ④ Korean language consistency ⑤ how well it distilled key points for management use.
| Axis | exaone | Claude | gpt-4o |
|---|---|---|---|
| Accuracy | 1 — numbers correct but missed key points | 2 — accurately identified load imbalance, low power factor, weekend baseline load | 1 — surface-level, didn’t use M&V |
| Hallucination | 2 — nothing fabricated | 2 — everything traceable to sources | 1 — “capacitor” hallucination |
| Sourcing | 1 — vague citation | 2 — accurately attributed M&V and visualization | 1 — missed mv_guideline |
| Language | 2 | 2 | 2 |
| Usefulness | 1 — broken index | 1 — incomplete due to 1024 token truncation | 2 — concise, clear structure |
| Total | 7/10 | 9/10 | 7/10 |
Claude performed best. If the token cap had been raised, it would have been a perfect score.
Cost-effectiveness perspective
exaone and gpt can be used at a lower cost than Claude → the next task is figuring out how to tune these models to approach Claude’s level. If I can solve this, it would be very economically advantageous.
Specifically:
- exaone — the broken index issue could potentially be fixed by enforcing an output format (JSON / numbered list)
- gpt — enforcing “don’t make things up” through few-shot examples rather than the system prompt might reduce hallucinations
Retrospective
Three key things learned today:
- The fork between inference and caution — in Q1, when exaone/gpt were conservative with “no data available,” Claude inferred from summary stats alone and disclosed its limitations. The difference in model personality is clearly revealed.
- The same model’s tendency can flip depending on question format — GPT was conservative in Q1 (inferring from existing facts) but suddenly hallucinated in Q2 (general recommendations). Judging a model based on a single case is risky.
- Output token caps significantly affect evaluation — Claude’s one-point deduction (9/10) was due to token truncation. In production, a combination of
max_tokens+ “key points only” prompting + response format constraints is needed.
Things to study further
1. Checking variance by repeating the same question multiple times
- Today’s evaluation was one response per question
- Repeat the same question 5-10 times to measure response variance and hallucination frequency
- “Does Claude always score 9/10, or does it average 9/10” is a different question
- Visualizing the effect of non-determinism (sampling temperature)
2. Patterns to prevent output token truncation
- Dynamically adjusting
max_tokens— proportional to question complexity - Enforcing length via response format constraints (JSON / short bullets)
- 2-pass approach — short summary first, then detailed elaboration
- Detecting token truncation + automatic continuation pattern
3. Automating hallucination detection
- An evaluator that automatically catches keywords not in the data, like GPT’s “capacitor”
- Extracting noun phrases from response text → checking whether they exist in the retrieved chunks
- Fact-checking with LLM-as-judge
- RAGAS’s Faithfulness metric
4. Low-cost model tuning strategy
- Refining the system prompt — explicitly teaching the patterns Claude does well
- Few-shot examples — showing exaone/gpt “answer in this format”
- Enforcing output schema — JSON Mode / Structured Output
- Comparing before/after tuning scores using the same corpus + evaluation set
5. Separating real-data RAG from synthetic-data RAG
- Today’s Q1 (synthetic) and Q2 (real data) used the same vector DB
- How would retrieval accuracy / response quality change if separated
- Search routing policy when operating both tracks simultaneously
- Preventing leakage where real-data-based questions pull in synthetic-data chunks
6. Automating evaluation set construction
- Today’s questions were written by hand
- Corpus chunks → LLM automatically generates questions → human review
- A larger evaluation set produces more reliable scores
- Directly connected to the evaluation set construction section in the RAG data preparation post